- Perspectives by Fourteen10
- Posts
- Your marketing budget is riding the wrong part of the curve
Your marketing budget is riding the wrong part of the curve
Ad platforms will always tell you to spend more. The question worth asking is: at what point does the next dollar stop working? That answer isn't in your dashboard. It's in the shape of your marginal cost curve.
Zachary Holt
March 26, 2026

The problem with average CPA
Your blended numbers are lying to you
Here is a scenario that plays out constantly. A brand has a profitable CAC target of $75. It looks at its Google dashboard, sees a CPA of $60 on $1000 spend, decides the channel is working, and increases the budget to $1500.
One month later the CPA is at the $75 CPA target, and the team declares optimal spend reached on Google. The problem is, they were actually above their profitable CAC target going from the $500 to $1000 level, and losing money on every customer since!
Monthly Spend | Customers | CAC | Marginal CAC |
|---|---|---|---|
$500 | 11 | $45 | - |
$1000 | 17 | $60 | $83 |
$1500 | 20 | $75 | $167 |
The brand was optimising against an average cost, not a marginal cost. That $60 CPA was a blend of cheap, high-intent conversions at the bottom of the funnel, and significantly more expensive incremental customers that the platform quietly acquired alongside them.
When you scale, you exhaust the cheap inventory first. You're left riding the expensive part of the curve you never knew you were on.
The two questions we always ask: what would happen if we didn't spend this money? And what would happen if we didn't optimise this spend?
Average CPA can't answer either of those questions. Marginal CPA can.
What marginal cost modelling actually is
The curve tells you where the money stops working
Marginal Cost Per Acquisition (mCPA) is the cost of acquiring the next customer at a given level of spend, not the average cost of all the customers you've already acquired. Similarly, we model Marginal ROAS (mROAS) and Marginal Profit-on-Ad-Spend (mPOAS) depending on the right unit economics for the business.
The insight comes from the shape of the response curve. Channels don't scale linearly. At low spend, you're picking off the most accessible, highest-intent conversions. As you scale, you move into progressively less efficient territory. The curve flattens. Marginal CPA rises. At some point, the next dollar is costing more than it returns.
The zone between your current spend and the point where marginal CPA crosses your target unit economics is your headroom, the safe spend range where growth remains profitable. This is the number that should be driving your budget decisions, not a dashboard metric.
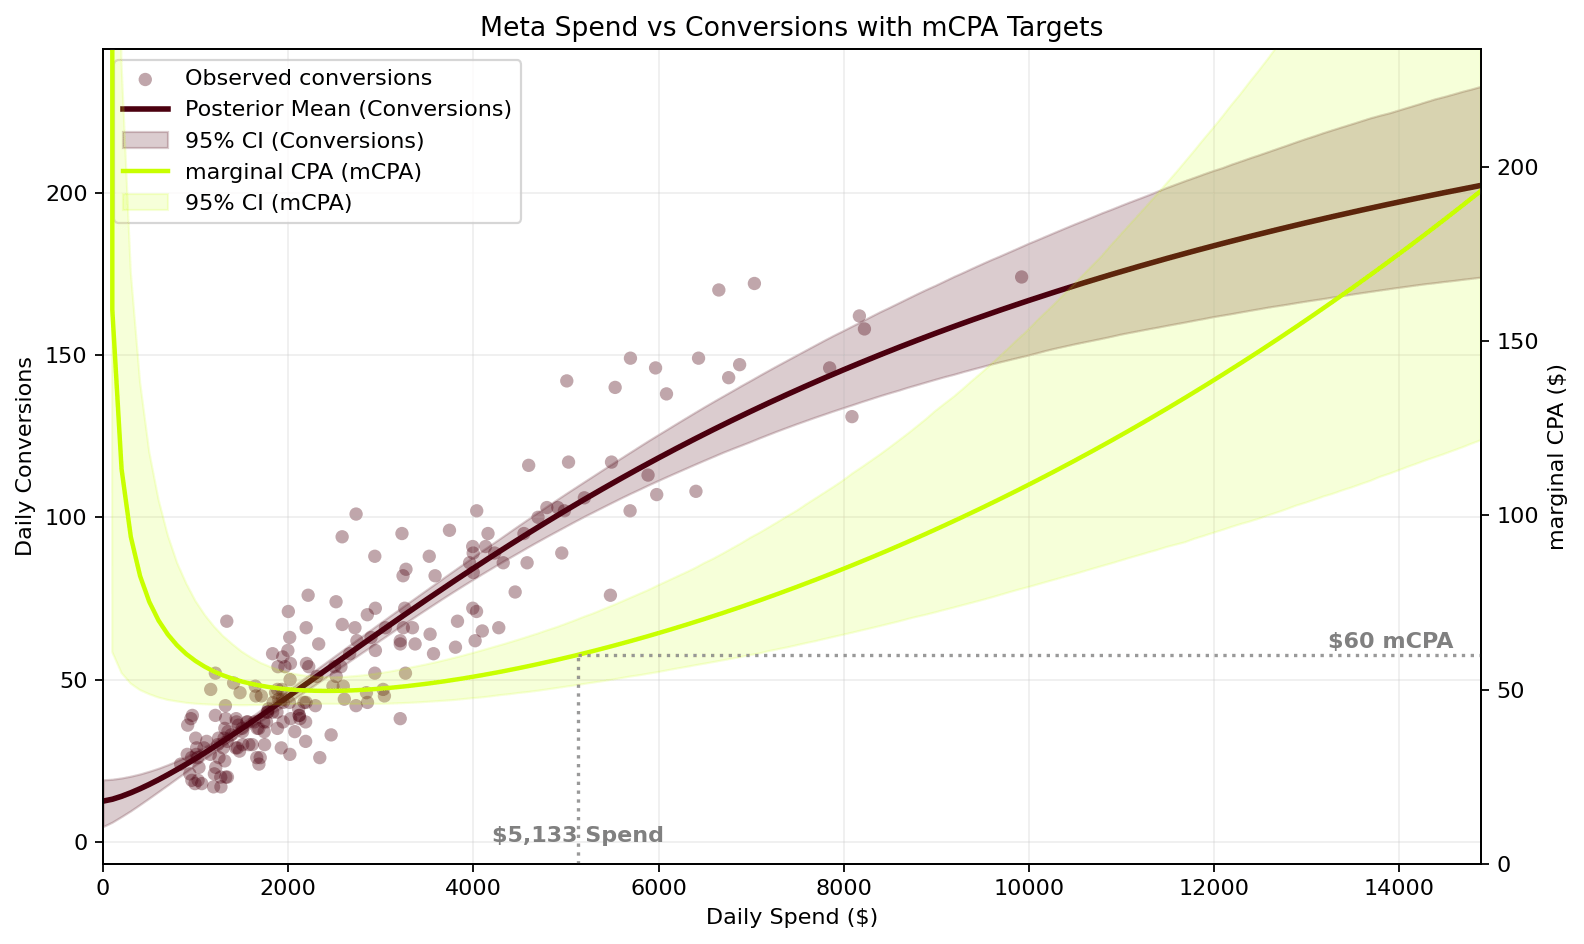
See it for yourself.
The interactive model below shows a real diminishing returns curve. Drag the target mCPA slider and watch the interaction between mCPA and Average CPA. Even at a $250 mCPA the Average CPA is still at $47, but you are spending significantly more with very few additional customers to show for it.
Most brands are operating somewhere in the middle of that curve without knowing it. The model tells you exactly where.
Three model variants
Depending on the client and their business model (+ data availability), we choose one of 3 model variants:
Marginal CPA - acquisition cost per new customer
Marginal ROAS - revenue return at the margin
Marginal POAS - profit-on-ad-spend, applying gross margin to conversion value. Anything above 1.0x means the company is making money on top of its ad spend.
💬 Common objection: "Isn't this just what our agency already does?"
Most agencies optimise toward the metrics the platform or GA4 reports. That's not the same thing. These metrics show you average return on spend. Marginal cost modelling is built on the ad platforms raw data, and tells you what happens at the next dollar — not what happened on average across the last 90 days. The output is a spend target and a confidence interval, not a ROAS number.
Why the platform won't tell you this
Ad platforms are not budgeting tools. They're auctions.
Google and Meta are exceptional at optimising toward the conversions you tell them to target. The problem is structural: their attribution models are designed to take credit, not to isolate incremental impact. They do not have an incentive to show you where your marginal returns are deteriorating.
Red flags that will corrupt a model
Good models need good data.
Running a model on dirty data produces precise nonsense. Some red flags that make it more difficult to build a useful model:
🚩 Brand exclusions not properly applied
If branded terms are running through non-branded or automated campaigns, the blended CPA is flattering a number that will collapse under scale. We have seen accounts where 20–30% of spend, and 60%+ of revenue is going to people who were already going to buy. That’s a 3-5x difference in return between branded and non-branded. Strip it out before you model anything.
🚩 Conversion event changes in the last 12 months
If conversion tracking has been modified, a new event added, an old one removed, primary conversion actions swapped, you can't simply treat the historical data as a single continuous series. There is real data engineering work that needs to be done to make sure the series is complete.
🚩 Newly restructured ad account (under 6 months)
A restructured account resets the data clock. We need a minimum of 6 months, preferably 12, under the current structure. Shorter periods produce noisy models, especially if they include sale events or other anomalies.
🚩 Overlapping or unclean conversion action setup
Multiple conversion actions firing for the same event, ambiguous event taxonomy, or conversions counted across different attribution windows will inflate the apparent efficiency of the account. Clean conversion definitions are non-negotiable before modelling.
💬 Common objection: "What if our data isn't clean enough to model?"
This is the most common blocker, and an honest one. If the data isn't clean, we say so rather than build a model on shaky foundations. In those cases the work starts upstream: fixing conversion tracking, cleaning up campaign structure, separating branded from non-branded correctly. That's not a detour, it's the prerequisite for any reliable decision-making, regardless of whether you're running a marginal cost model or not. We do an account review before any engagement to identify these issues upfront, so there are no surprises.
How we actually build it
A Bayesian curve fit. Not a spreadsheet guess.
The model uses a Hill function, a diminishing returns curve borrowed from pharmacokinetics, fitted to your actual spend and conversion data using Bayesian inference across 16,000 simulations. Rather than giving you a single best-fit line, it produces a distribution of plausible curves, so we can quantify uncertainty in our headroom estimates honestly rather than presenting false precision.
We account for weekly seasonality through Fourier terms, use your ad data pulled into BigQuery, and validate the model against held-out periods before treating it as actionable.
The output isn't a complex model that lives in a notebook. It's a clear answer to a clear question: at your current unit economics, what is the monthly spend ceiling for each channel before you're destroying value, and how confident are we in that number?
💬 Common objection: "This sounds very technical. Do we need a data team?"
No. The model is built by us and the output is a number your marketing and finance teams can act on directly: here is your channel spend ceiling, here is how confident we are, here is what happens if you go beyond it. The technical complexity exists so the answer is trustworthy, not so it requires a data scientist to interpret.
💬 Common objection: "How often does the model need to be updated?"
Quarterly refreshes are typically sufficient. The curve doesn't move dramatically week to week unless something structural changes e.g. a major creative shift, a new audience strategy, a significant budget change. When experiments run and learnings accumulate, the model gets updated to reflect the new economics. It's a living input, not a one-time audit.
From model to monthly budget
The practical output: waterfall budgeting
Knowing your headroom is only useful if it changes how you allocate budget. This is where the model earns its keep.
Each month, we use the marginal cost curves to run a waterfall budgeting process:
Find the channel with greatest spend potential. Use the marginal acquisition model to identify the campaign or channel furthest from its efficiency ceiling.
Spend until ROI descends to target threshold. Allocate spend into that channel until its marginal cost reaches your target, say, a mROAS of 200%.
Hold steady and cascade. Move remaining budget into the next most efficient channel. Repeat until the full budget is deployed or all channels have hit their ceiling.
Refresh and repeat each month. Re-run the process with updated curves that incorporate experiment learnings from the period prior.


The result is a spend distribution that reflects actual diminishing returns across your channel mix. Not gut feel, historical precedent, or platform recommendations. Every dollar is allocated to where it has the most room to work before hitting its ceiling.
This also changes the budget conversation with your CFO entirely. You're not defending spend levels with platform metrics. You're showing the marginal economics behind every allocation: here is why we're spending more on Meta than Search this month, and here is the exact point at which either of those numbers stops making sense. That's a conversation worth having.
The bigger picture
The model is a starting point. Not the answer.
Marginal cost modelling tells you where you are on the curve today. It does not tell you how to move the curve. That's the harder problem, and the more valuable one.
The goal isn't just to know your headroom. It's to systematically expand it: finding creative angles, audience structures, channel combinations, and brand investment levels that shift the diminishing returns curve outward, so that at any given spend level you're generating more incremental conversions than before. We call this "beating the curve."
The framework:
Clean data foundations — First-party tracking, clear conversion definitions, consistent attribution windows. Everything downstream depends on this being right.
North star metrics and drivers — Align on the one metric that actually matters for the business, not a proxy, and map the levers that move it.
Build the marginal cost model — Fit the response curve. Quantify headroom per channel based on your actual unit economics.
Run waterfall budgeting — Allocate monthly budget by cascading spend into channels in order of efficiency, stopping each when marginal cost hits the target threshold.
Run rapid experiments — Structured tests designed to beat the curve, improving underlying economics rather than re-optimising existing spend. This includes both performance-level tests and brand activity designed to shift the baseline.
Compound the learning — Experiment results feed back into the model. What works shifts the curve. What doesn't informs the next test. The system gets smarter over time.
Speed of learning is one of the few genuine competitive advantages available to a brand. The faster you can run quality experiments and compound those learnings, the faster you can move the curve, and widen the gap between you and everyone following the same platform playbook.
💬 Common objection: "We already run experiments. How is this different?"
Most experimentation in paid media is tactical: test ad A vs ad B, compare audiences, toggle bidding strategies. That's useful but it optimises within the curve rather than changing its shape. What we're describing are experiments designed to answer a different question: what would it take to acquire the same customer more cheaply at higher volume? That might involve creative strategy, landing page architecture, offer structure, brand investment, or channel mix. The marginal cost model gives you the benchmark to know whether an experiment actually moved the economics, or just moved the numbers.
The honest version
This is harder than it looks. That's why it works.
Marginal cost modelling requires clean historical data. Minimum six months, preferably twelve. Consistent conversion tracking, and a willingness to accept that your current numbers might look worse once you strip out branded and attributed-but-not-incremental conversions.
Most brands don't do this. They optimise against the numbers the platform gives them, scale until CPAs blow out, pull back, and repeat. The ceiling never moves.
The brands that grow sustainably are the ones that understand exactly where their growth economics break down, and build a system to push that boundary outward. The model isn't a magic number. It's a shared language between your unit economics and your media decisions, updated continuously as you learn.
Following the same ad platform best practice playbooks as everyone else is a fast way to generate average results. Our job is to find arbitrage opportunities, thinking from first principles, not blindly copying the herd.
💬 Common objection: "Is this worth the investment for a brand our size?"
The model makes most sense if you're spending enough in paid channels that a 10–20% budget misallocation is a real number. If you're spending $20k+/month across paid channels, the headroom question matters. If you're spending $5k/month and still finding product-market fit, there are more pressing problems to solve first.
What’s your actual headroom?
If you're spending $20k+ per month across paid channels and making budget decisions based on platform CPAs, there's a reasonable chance you're either leaving money on the table or scaling past the point where it's working, possibly both. We run a headroom diagnostic as the starting point for every engagement: a review of your current account structure, data quality, and an initial read on where your spend ceiling likely sits.
Get in touch to get started.